|
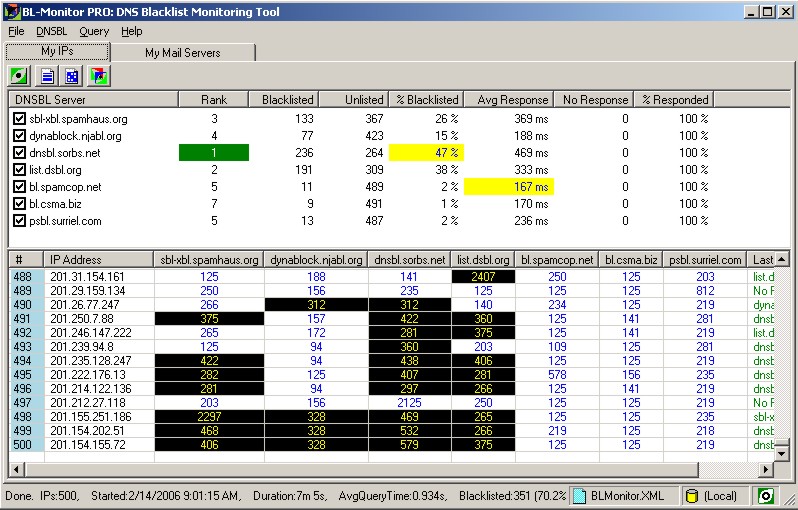
The BL-Monitor "MY IPs" interface is designed to
give an instantaneous, comprehensive view of how well the selected
DNSBL servers are performing. |
Divided into two sections, the "DNSBL Server" list and the "IP Address" area, the color-coded BL-Monitor
easily details the most effective DNSBL servers for your environment. |
|
|
| DNSBL SERVER LIST
Section |
IP ADDRESS Section |
| This top area of the interface details an on-going summary of information on all
selected DNSBL servers and their effectiveness. |
The lower portion of the BL-Monitor
interface displays the actual timing results for each IP address
that has been queried |
| Column |
Description |
| DNSBL Server |
DNSBL server's URL |
|
|
| Rank |
Rank determined by factoring
DNSBL server effectiveness and speed.
|
COLOR CODED RESULTS |
| CELL |
RANK |
|
|
Best server |
|
|
Best individual result |
|
|
Other server ranks |
|
|
|
|
| Blacklisted |
Number of queries when IP address was blacklisted |
|
|
| Unlisted |
Number of queries when IP addresses was unlisted |
|
|
| % Blacklisted |
Percent of queries IP address was found to be blacklisted |
|
|
| Avg Response |
Average response time for each query |
|
|
| No Response |
Number of times DNSBL server did not respond
and query timed out |
|
|
| % Responded |
Percent of queries DNSBL did not respond |
|
|
|
| Column |
Description |
| # |
Counter |
|
|
| IP Address |
IP address being queried |
|
|
|
DNSBL servers.
One per column |
Each column represents one DNSBL.
Numbers indicate
the
response times in milliseconds.
|
COLOR CODED RESULTS |
| CELL |
IP STATUS |
|
|
Blacklisted |
|
|
Unlisted |
|
|
Server unavailable |
|
|
|
|
| Last Info returned |
The last detailed response from a DNSBL server
(slowest) is recorded. |
|
|
|